• UI/UX

  • Development

  • Digital

  • Analytics

Landing Page Optimization

Page Speed & Conversion Rate Performance Enhancements

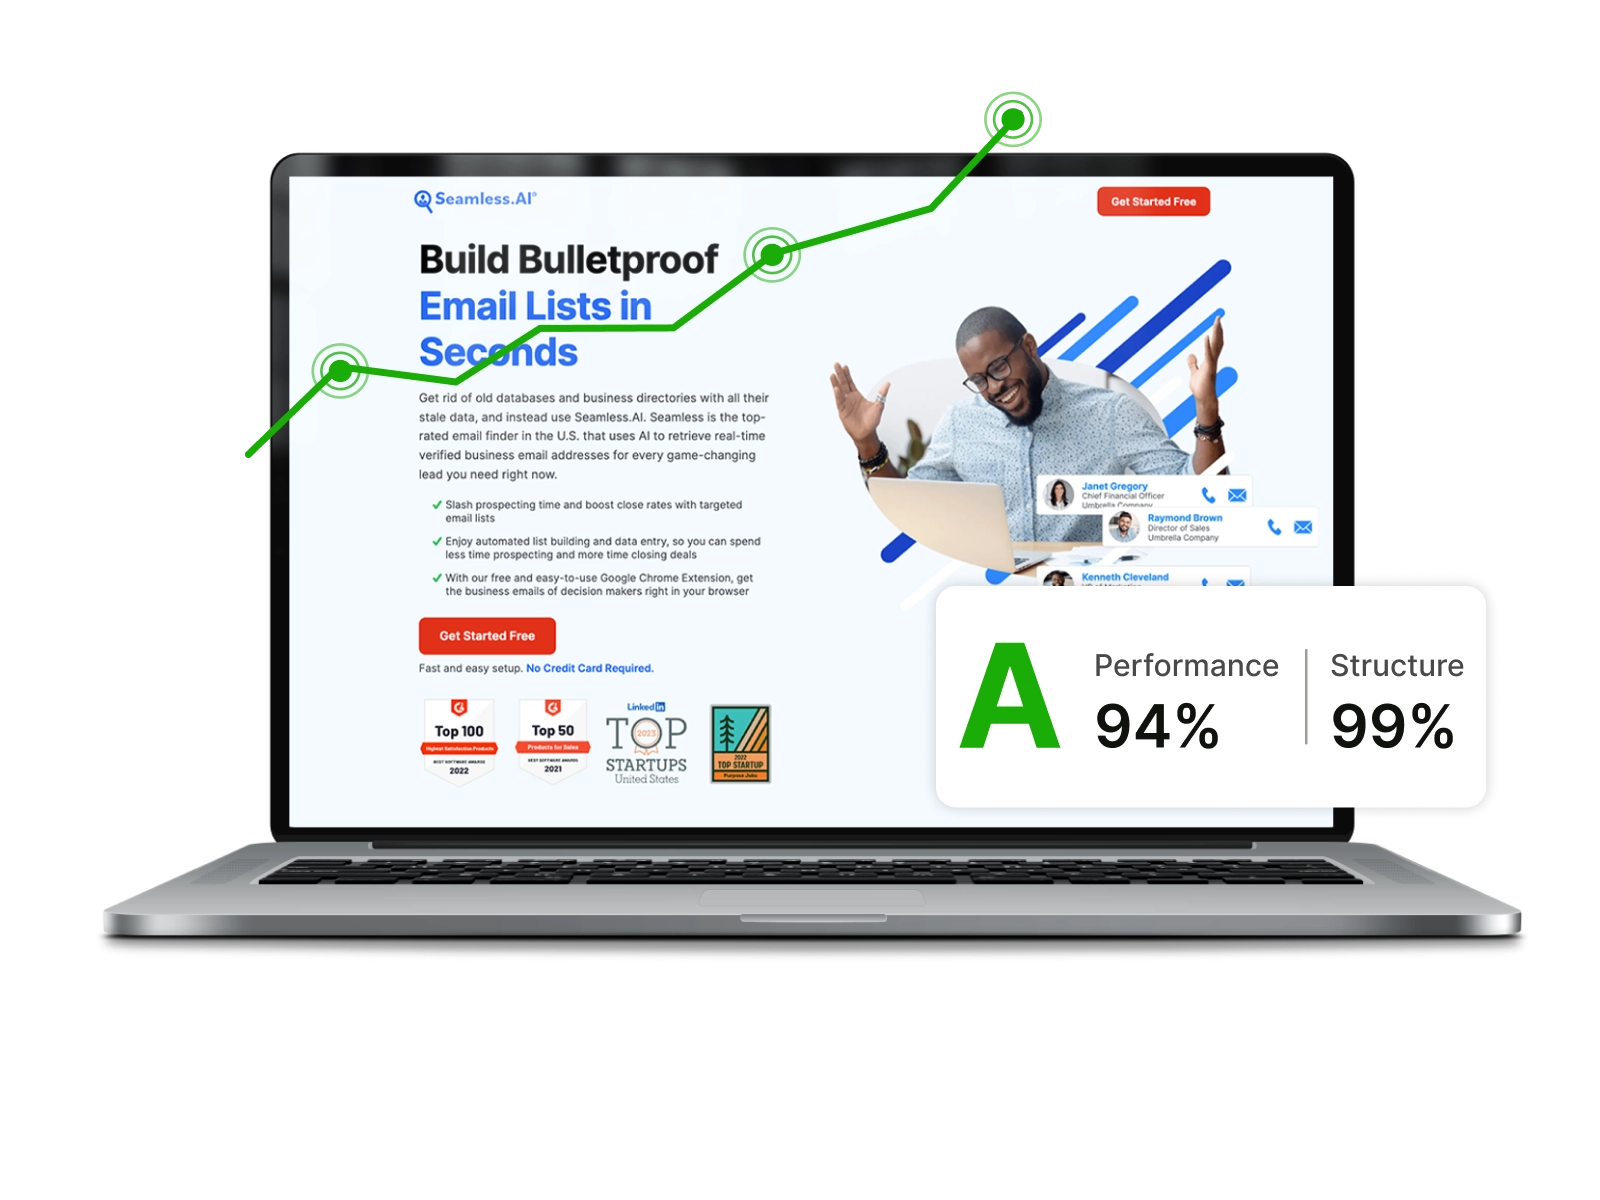
Laptop showing an example landing page with a upward trending line graph and a high perfromace score overlayed

Creative Breif

Marketing was using 2 what you see is what you get (WYSIWYG) builders to launch landing pages for paid media and other business cases. These builders were chosen for their ease of use and speed to market. When I joined the company, it became apparent that these pages could be drastically improved. Using my technical skillset, I took initiative to optimize these pages and ultimately improve conversion rates.

Tools

  • GTmetrix icon logo

    GTmetrix

  • Google Analytics icon logo

    Google Analytics

  • Visual Studio Code icon logo

    Visual Studio Code

  • Adobe Photoshop icon logo

    Photoshop

  • Chickfunnels icon logo

    Clickfunnels

  • Instapage icon logo

    Instapage

  • Webflow icon logo

    Webflow

My Role

Developer

Deleverables

10 Pages

Challenges

  • Current WYSIWYG builders added a lot of bloat to the code which effected page speed performance.
  • Building dynamic customizations took longer to implement.
  • Having these pages hosted on subdomains took the conversions and SEO value away from the main domain.

Process

  • 01

    Audit Current Pages

    Icon of a waving flag
  • 02

    Implemented Best Practices

    Icon of a computer monitor
  • 03

    Monitored Performance

    Icon of an open eye
  • 04

    Content & Design Updates

    Icon of box divided into 3 sections
  • 05

    Reporting

    Icon of a bar chart

Results

  • Tackled this project in a 2 phased approach to better understand how changes impacted performance.
  • Reduced bloat from WYSIWYG builders by correctly styling the base content with CSS to make a responsive layout.
  • Implemented semantic HTML, image optimizations, and accessibility best practices throughout.
  • Transferred all active pages to our main domain in order to have content and conversions contributing their SEO value appropriately.

Efforts made a 31% average increase in Page Speed Performance, a 60% average increase in Session Conversion Rate, and a 45% average increase in User Conversion Rate.

Phase 1 of this initiative focused on increasing page speed performance. This set a baseline for if the content of the page was working before making changes. The current landing pages were seeing a lot of traffic from paid media, so improvements would have an immediate impact.

Phase 2 was all about conversion rate optimization. This phase happened after the launch of the new marketing site. Seamless.AI now had a new platform to handle all the challenges the WYSIWYG builders did not excel at. As a 1-to-1 comparison, landing pages were transferred over to Webflow with very minimal design edits. Ad traffic was then split between the original and newer pages in order to not shock the ad platforms. Within 1 month, the new pages started outperforming the older ones.

Because of the initial success of this project, I plan to continue iterating these pages with input from the paid media team to further optimize and improve performance. We now have a strong foundation to base future comparisons on.

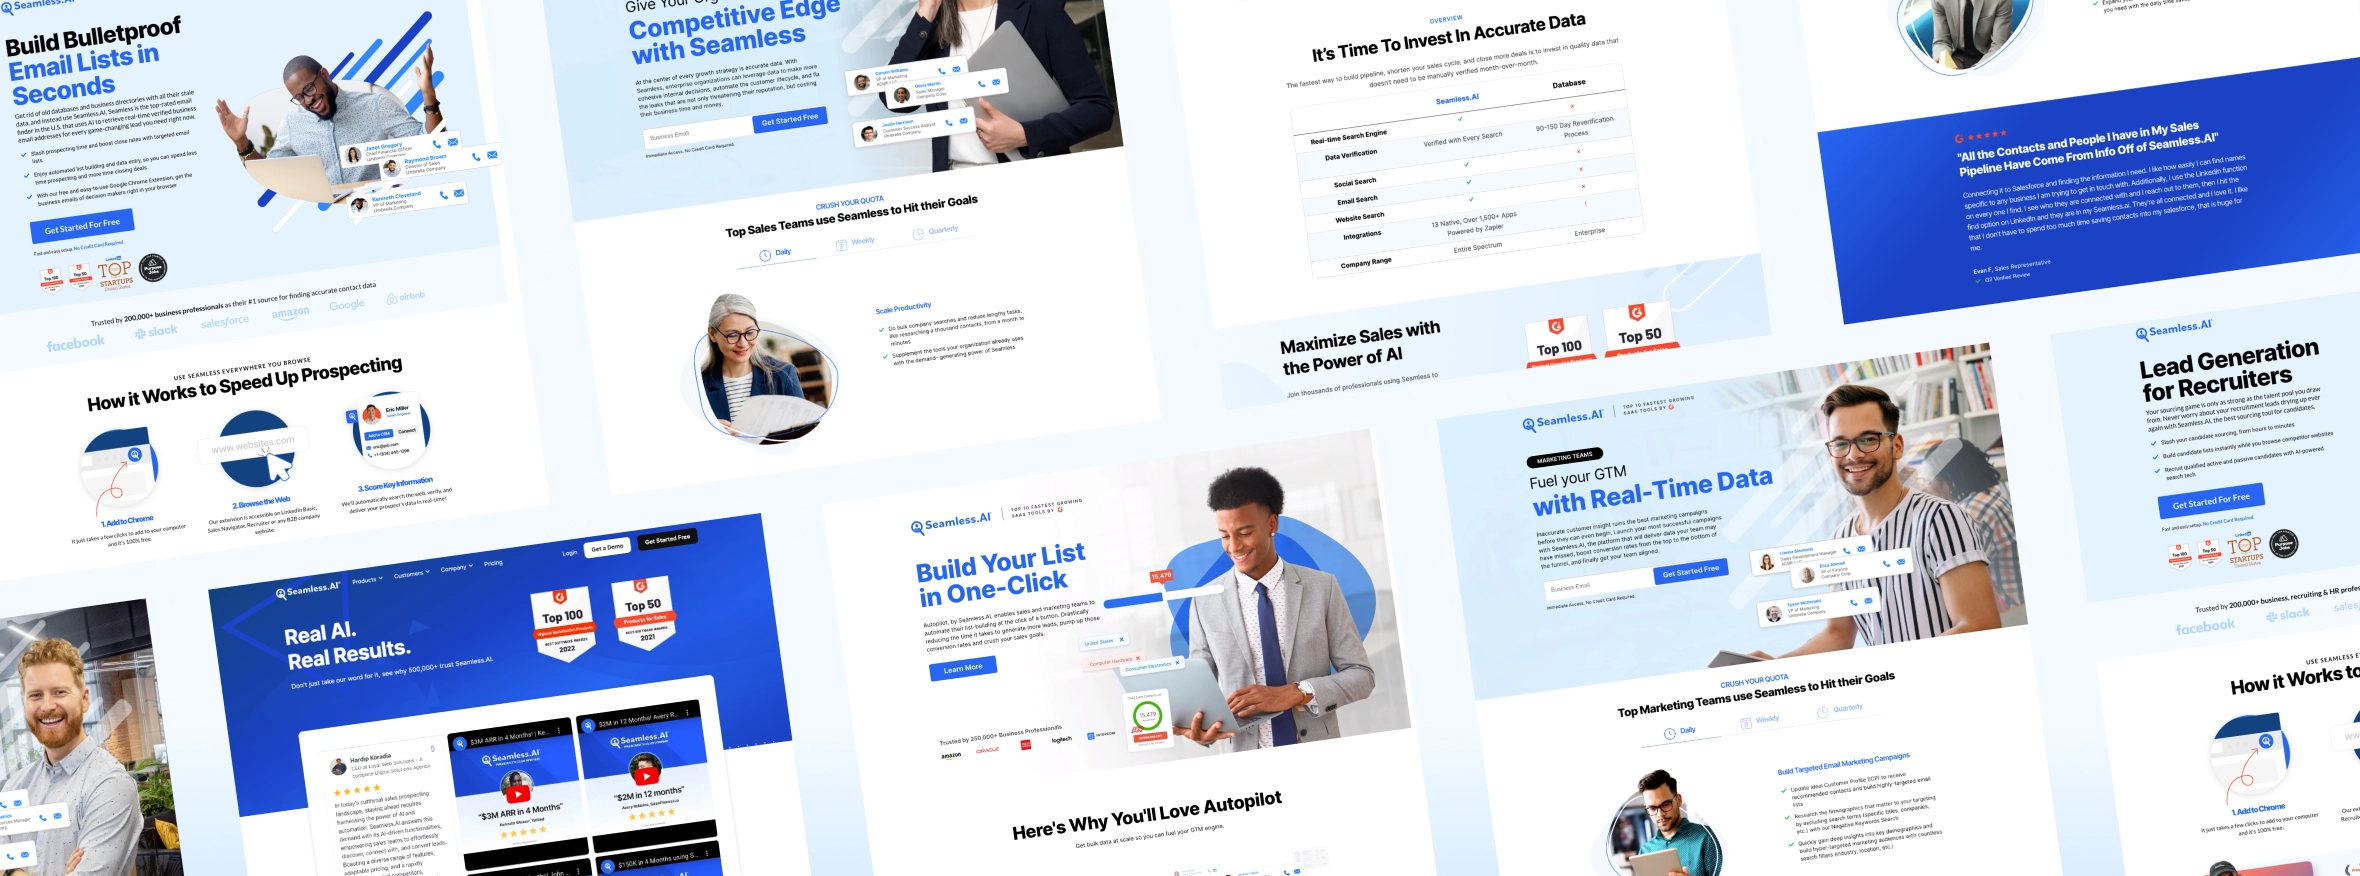
Landing pages tiled within frame

Page Speed Performance

Overview

Ideally, a page should load within 3 seconds. In fact, 40% of users will abandon a site for anything longer. In order to establish a baseline for the current content and design, pages needed to load quicker.

Among other issues, current pages were bloated with unnecessary code, text was being rasterized within images, image file sizes were massive, and no accessibility standards were being utilized. Fixing these issues would not only help pages load faster, but also increase SEO and ad relevance - ultimately driving more traffic.

Phase 1 Improvements

  • Semantic HTML
  • Consolidate Code
  • Image Optimizations
  • Accessibility Best Practices

Performance

Page % Increase Original New
B2B Business Emails
38%
D 56% A 94%
Industry Appointment Setting
51%
E 41% A 92%
Industry Freight
45%
E 48% A 93%
Industry Recruiting
27%
C 65% A 92%
Persona Enterprise
17%
C 75% A 92%
Persona Marketing Teams
17%
C 75% A 92%
10 Secrets to Book Meetings
10%
D 56% C 66%
Autopilot
27%
D 53% B 80%
Competitor
42%
D 53% A 95%
Reviews
31%
D 56% B 87%

The goal was to get every page scoring at an A or B. At this stage, nothing was cut from the design or content. For this reason, some pages were able to score better than others. Pages that were built like funnels (extremely long) or integrated third party code were among the pages that were harder to optimize. In these cases, I was still able to drastically improve the performance of the page. More severe edits would need to be made to improve further.

Overall, these structural updates signaled a positive change in Google Ads. Ad relevance increased for the terms the Paid Media team built campaigns around, which led to an increase of traffic to these pages.

Conversion Rate Optimization

Overview

Across all industries, the average landing page conversion rate was 2.35%, with the top 25% converting at 5.31% or higher. Keep in mind that conversion rates will vary depending on what the conversion actually is. For example, the conversion rate for downloading a free piece of content is likely to be higher than it will be for a paid purchase.

The conversion for these pages is a free trial offer to the Seamless.AI platform. While there is no payment information needed from the user, the signup process adds complexity to the conversion.

Phase 2 Improvements

  • Updated Business Stats & Awards
  • New Featured Products
  • Industry Relevant Case Studies
  • Brought Design into Brand

Performance

Session Conversion Rate
User Conversion Rate
Page % Increase Original New % Increase Original New
B2B Business Emails Session Conversion Rate
71%
2.12% 3.63% User Conversion Rate
31%
2.97% 3.88%
Industry Freight Session Conversion Rate
48%
2.73% 4.04% User Conversion Rate
27%
3.55% 4.49%

Testing started with 2 of the landing pages that had the most promise based on data from Google Ads. Paid Media was getting a decent amount of traffic and click through rate on ad spend. This would allow us to see results quickly.

Ad traffic was split between the original and newer pages. Within 1 month, the new pages started outperforming the original ones - even with Google still favoring the originals because of their longer history. In order to build history quicker, the original pages were throttled at bit. In the end, the original pages were turned off and 100% of traffic was sent to the new, better converting pages.

Original

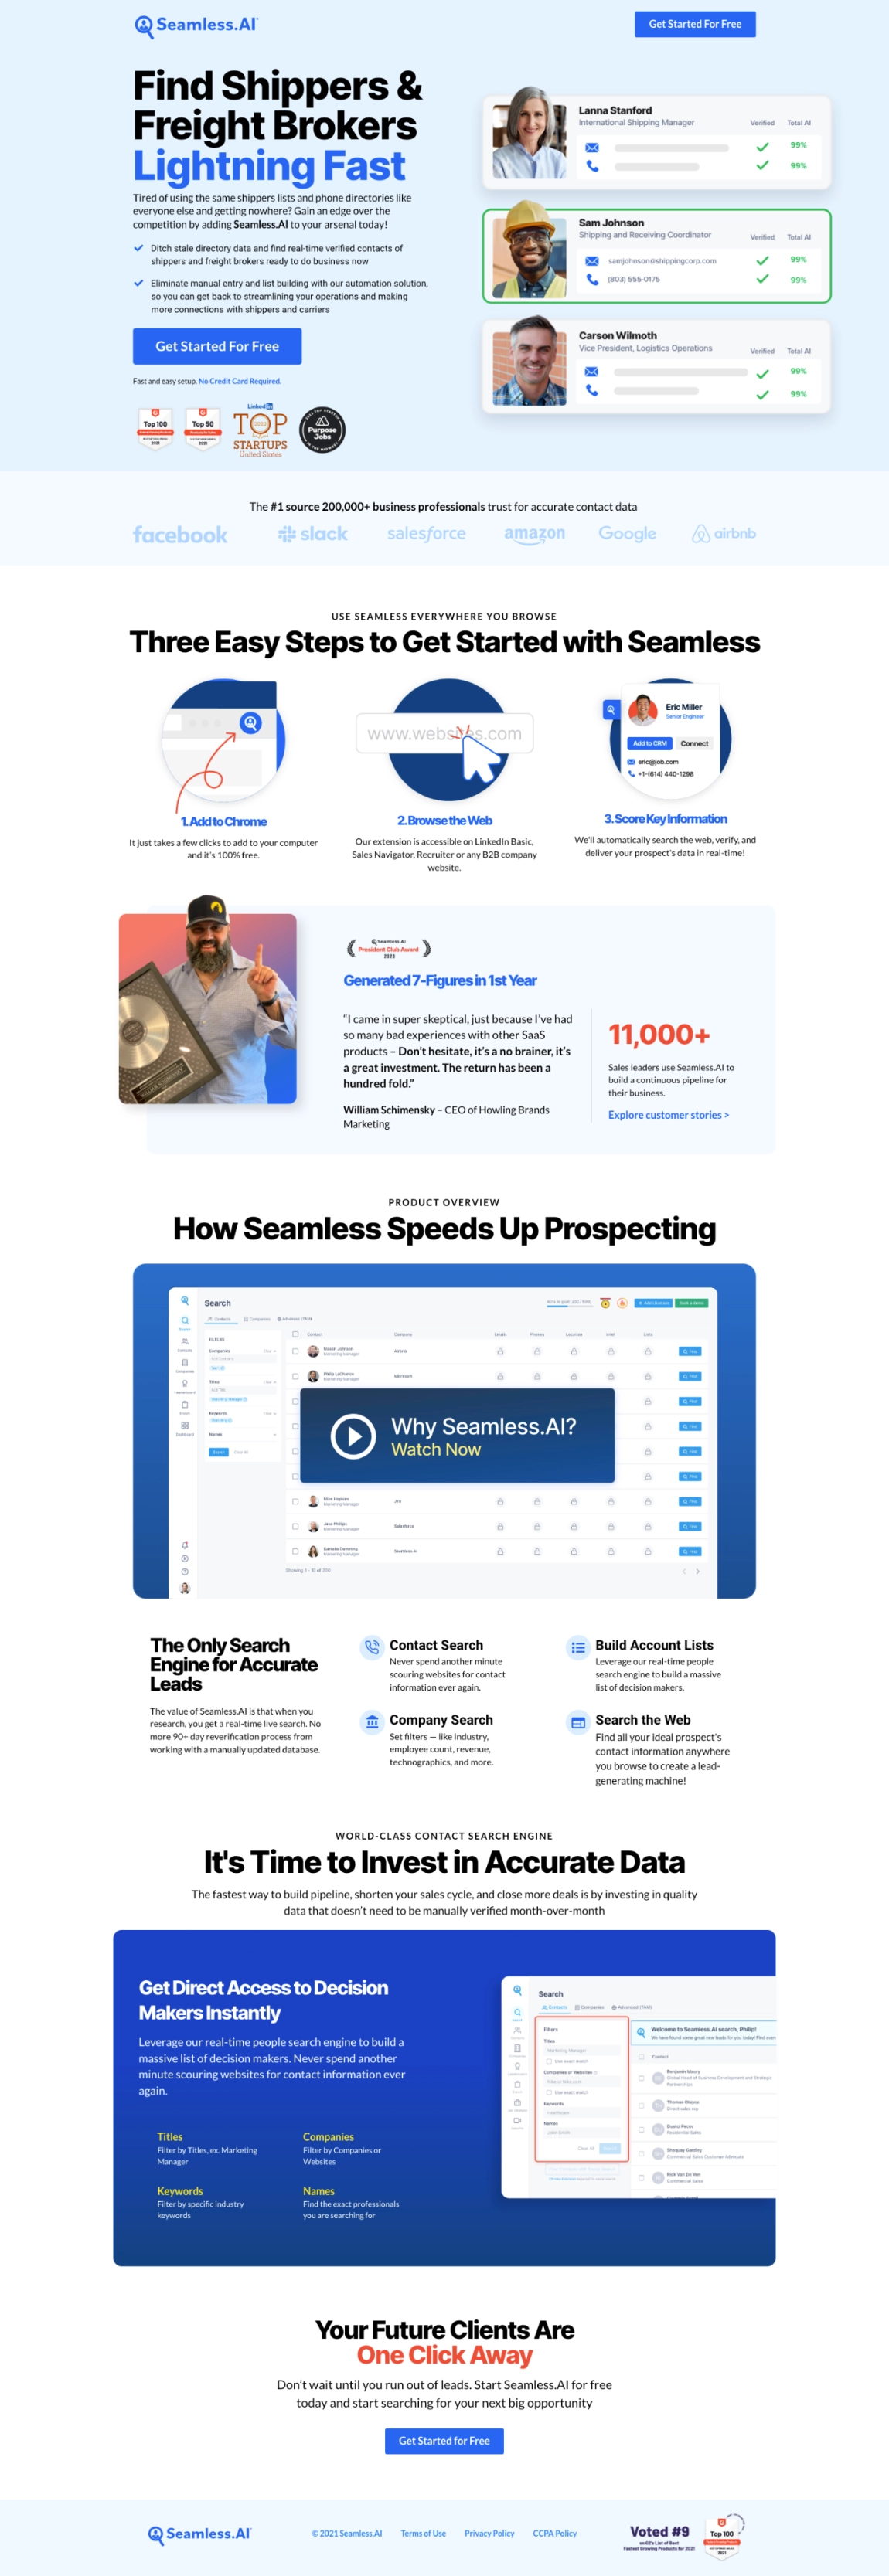
Example of the Freight landing page before any optimizations

New

Example of the Freight landing page after optimizations

Final Thoughts

Initial updates provided a minimal facelift to the overall content and design. I would say the largest improvement happened through upgrading the overall structure in the backend.

I will continue to monitor the performance of these pages and gather more detailed user information from heat maps, click engagement, and anonymous session recordings. From there, I can make plans to further iterate and test.

Overall Achievements

  • 31% Avg Increase

    in Page Speed Performance Across 10 Pages

  • 60% Avg Increase

    in Session Conversion Rate Across 2 Pages

  • 45% Avg Increase

    in User Conversion Rate Across 2 Pages

Quotemarks

Shoutout Chelsea for the suggestions that we took to improve the Chrome Extension page. Definitely seeing higher adoption rates since those updates.

Photo of Mason Johnson

Mason Johnson

Sr. Product Manager, Seamless.AI